Your institution generates tons of data: exam results, fee collections, enrollments, attendance, etc. Raw data is only useful when you can turn it into actionable insights.
ECAS empowers administrators, department heads, and other stakeholders with robust reporting to understand performance, spot trends, and make informed decisions.
You begin by selecting a group or subset of students or records via ECAS’s advanced filtering system.
All relevant fields are available for search, ready to be combined into complex queries.
From there, the system transitions you into the Reports Panel.
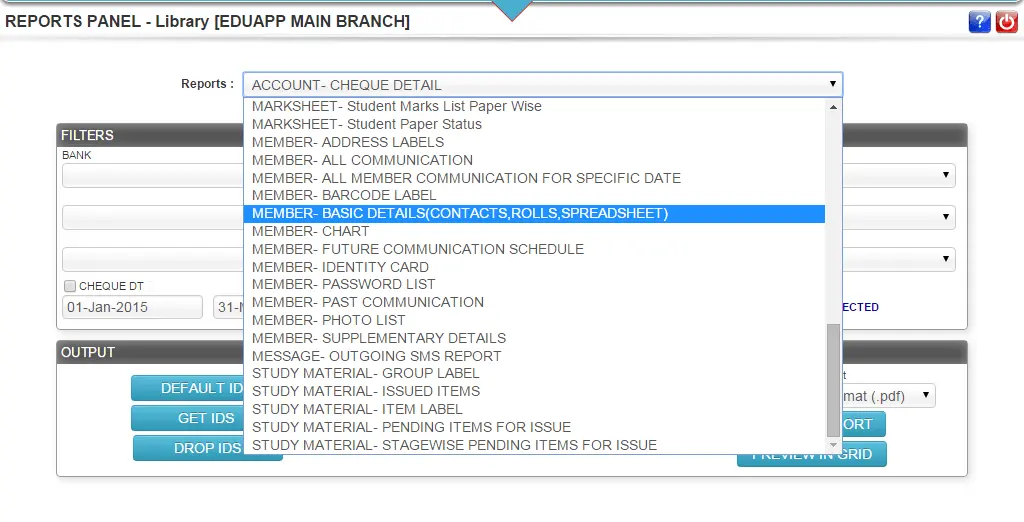
After filtering, choose from a wide dropdown of predefined reports (prefixed by module names for clarity).
For each report type, you get a preview link that shows sample layout, options, and possible parameters.
Once you pick a report, context-specific filters appear (called sub‑filters) to narrow down exactly what you want.
You can even treat the generated report’s results as input to the next level of filtering (“report output used as filter tool”).
A single report type can be rendered in multiple layouts: daily summary, weekly grouping, date-wise view, class-wise grouping, module-wise, etc.
Within the same layout, super-filters let you isolate subtleties (e.g. “only cash transactions,” “cheque-only,” “due > ₹1000,” etc.).
After filtering and layout selection, export the results into formats such as PDF (default), Excel, CSV, XML, and more.
Users choose their preferred format from a dropdown just before generating the report.
Only users with appropriate permissions can access the Reports panel.
Even then, their scope is limited: a user in Branch A sees only Branch A data; Head Office users may see combined or branch‑wise data.
The system also controls which export types the user can use (some users may only get PDF, others Excel/XML).

Q: Can I run multiple reports from a single filtered dataset?
A: Yes. One data query can generate any number of different reports (for example: a fee dataset can yield collection register, duplicate receipts, dues list, summary per head, etc.).
Q: Are sub-filters reusable?
A: Yes. Reports output can themselves be inputs to additional filtering, letting you zero in on the exact data you want.
Q: Why are there multiple layouts per report?
A: Because different stakeholders may need different views (daily vs weekly, class-wise vs branch-wise, etc.). This flexibility makes reports more useful.
Q: Which export formats are supported?
A: PDF (default), Excel, CSV, XML — depending on privileges.
Q: Can any user open the Reports section?
A: No, access is controlled. The system evaluates branch affiliation, module permissions, and export rights.
Read more:
Related Links:Addmen Group Copyright 2025. All Rights Reserved.